Live Dashboard Powered Results for Healthcare Market Research
Conducting market research requires all elements of the study design to coalesce with meaningful results teams can interpret and apply. Each research element is meticulously reviewed and agreed, from the respondent screening criteria to the moderator discussion flow. There is often a missed opportunity to ensure all of the hard work and dedication to the study is articulated in ways to showcase and enable the results, mainly due to reporting artifacts being overly static in fixed dimensions.
What if the study results, findings, and data could be put into a form allowing each constituent to derive the value from the study on their own terms? For example, a marketing director might want some direct quotations from a qualitative interview. Or, a business analyst might want to compare specific scores against a similar set done a few weeks or months ago to investigate a trend or shift in opinion.
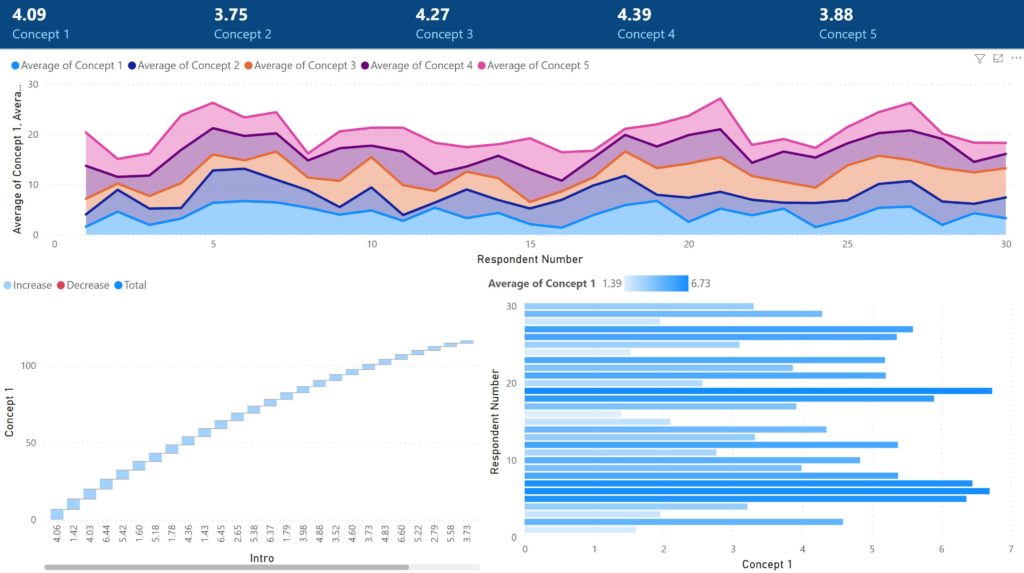
A great way to achieve this form is through a live dashboard with intuitive, simple to navigate depth in multiple dimensions. In the dashboard example, a main view provides a zoomed out, high level perspective of the study results. There are multiple stories in the information, each deriving its plot from where the user wants to go. Did this specific concept test score well compared to the others? Which respondents were spoke positively about the text of the concept?
Trends and answers are illuminated as the information is navigated via selections. At any point, the story can be bookmarked to share with others, or reset to start new navigation. Knowvanta’s Machine Learning and Sentiment Analysis results are integrated into dashboard views as well, enabling a much richer layer of detail for comparison and research conclusions.
Dashboarding serves not only as a compliment to detailed reporting documents, but it also enables more dynamic results as questions and topics arise, days or even months after a study has concluded.
Contact us to learn more about Knowvanta’s approach to dashboarding as a research enabler.

